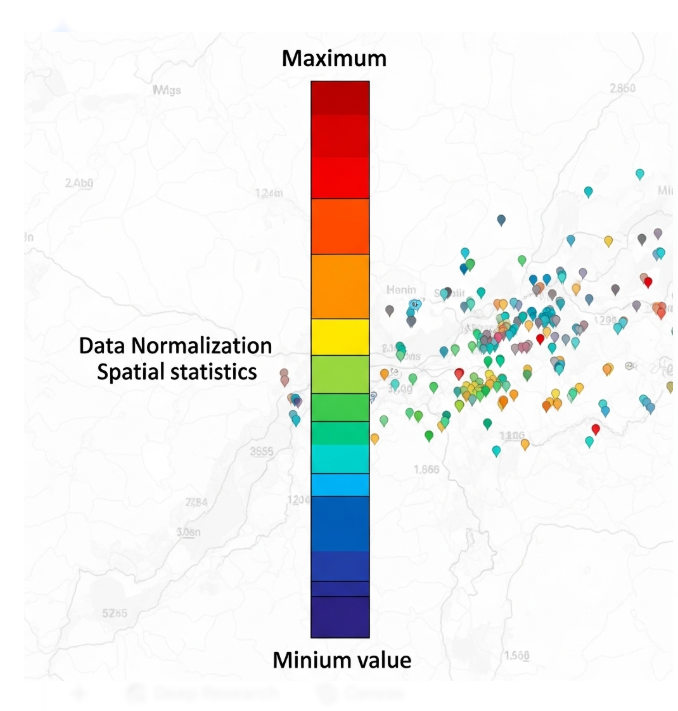
Range
The difference between the maximum and minimum values of a dataset, used in spatial statistics and data normalization (inferred from standard GIS usage).
What does Range refer to?
The difference between a dataset's maximum and minimum values is referred to as range in statistics and GIS. It is a fundamental indicator of data spread or dispersion that illustrates the degree of variability present in a particular set of values.
Formula:
Range=Maximum value−Minimum value\text{Range} = \text{Maximum value} - \text{Minimum value}Range=Maximum value−Minimum value
Range helps find variability or spot outliers by giving a brief overview of how widely distributed the values in a dataset are. It does not, however, take into consideration the distribution of values between the extremes.
Related Keywords
The difference between a dataset's greatest and minimum values, such as elevation, temperature, or population density, is referred to as range in GIS. It provides information about how values are dispersed within a geographic area by measuring the variability or spread of spatial data.
The distance between the sensor and the target or object being viewed on the surface of the Earth is referred to as range in remote sensing. It establishes the range at which a sensor can identify and quantify signals, such as radar pulses, reflected sunlight, or radiated radiation. The range affects the kind of information that may be obtained from the sensor as well as image resolution and accuracy.
A range domain in GIS establishes the acceptable numerical values that an attribute may have. By establishing minimum and maximum boundaries and making sure that numbers fall inside a legitimate range, it serves to ensure data integrity. To avoid invalid entries outside of this range, a temperature attribute can, for instance, have a range domain of -50°C to 60°C. In spatial datasets, this preserves accuracy and consistency.
A data range in GIS (Geographic Information Systems) is the range of values that an attribute or dataset encompasses. For mapping, analysis, and visualization, it aids in comprehending the minimum, maximum, and distribution of numerical or spatial data. A temperature layer, for instance, might comprise data ranging from -10°C to 45°C, dictating how symbols or colours are used on a map.