
How to Plot Maps with Cartopy in Python
Map creation via programming is an integral aspect of GIS, Geospatial analysis, remote sensing, and scientific visualization. There are several libraries available in Python that can be used for working with spatial data, and Cartopy is a very useful library for generating maps along with projections, coastlines, borders, grids, and spatial datasets.
The library works best with Matplotlib, where the user can generate maps of high quality while having full control over projection and other aspects of the map. This tutorial is designed to help the user install Cartopy, generate basic maps, and plot geographic data.
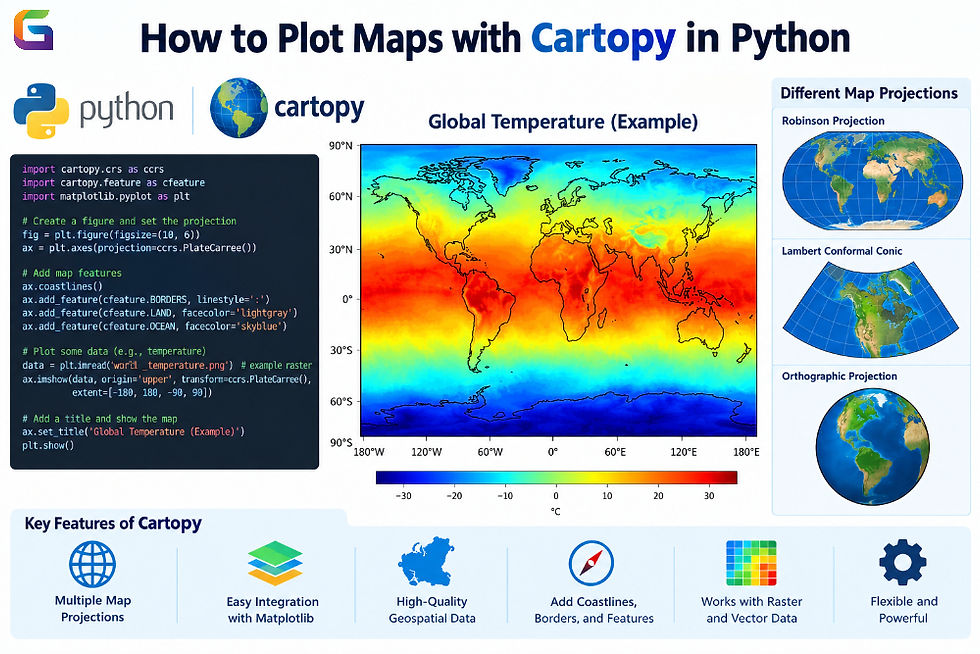
What Is Cartopy?
Cartopy is an open-source Python library created for dealing with geospatial information and mapping data. This library adds support for projections and transformations, geographic shapes, boundaries, coastlines, and more to Matplotlib.
As opposed to a standard Matplotlib plot, Cartopy maps are aware of geographic coordinate systems and can perform transformations of data to various projections.
Applications of Cartopy include:
Geographic visualization
Satellite imagery and remote sensing
Weather and climate maps
Oceanography
GIS applications
Scientific presentations
Exploration of spatial data
Environmental monitoring
Why Use Cartopy for Mapping?
The following are some of the benefits associated with Cartopy when it comes to geospatial visualizations with Python.
Support for Map Projections
Some of the supported map projections by Cartopy include the following:
Plate Carrée
Mercator
Lambert Conformal
Orthographic
Robinson
Albers Equal Area
Polar Stereographic
Integration With Matplotlib
Since Cartopy is compatible with Matplotlib, one can take advantage of functions like plot(), scatter(), contour(), and imshow().
Geographic Features
Cartopy can plot the following features:
Coastlines
Borders between countries
Borders within countries between states/provinces
Rivers
Lakes
Landmasses
Oceans
Coordinate Transformation
Cartopy can transform geographic coordinates from one coordinate reference system (CRS) to another, which is essential when working with spatial datasets.
How to Install Cartopy
Before creating a map, install Cartopy and Matplotlib.
Using pip:
pip install cartopy matplotlibYou can verify the installation with:
import cartopy
import matplotlib

print(cartopy.__version__)
print(matplotlib.__version__)
For scientific geospatial workflows, Cartopy is often used alongside packages such as NumPy, Xarray, GeoPandas, Rasterio, and Shapely.
Creating a Basic Map With Cartopy
The simplest Cartopy map can be created by specifying a projection when creating the Matplotlib axes.
import matplotlib.pyplot as plt
import cartopy.crs as ccrs

fig = plt.figure(figsize=(10, 6))

ax = plt.axes(projection=ccrs.PlateCarree())

ax.coastlines()

plt.show()
Here, ccrs.PlateCarree() defines the map projection, while ax.coastlines() adds coastlines to the map.
The resulting figure provides a basic geographic map that can be customized with additional layers.
Adding Coastlines and Geographic Features
Cartopy provides built-in geographic features through cartopy. feature.
import matplotlib.pyplot as plt
import cartopy.crs as ccrs
import cartopy.feature as cfeature

fig = plt.figure(figsize=(10, 6))

ax = plt.axes(projection=ccrs.PlateCarree())

ax.add_feature(cfeature.LAND)
ax.add_feature(cfeature.OCEAN)
ax.add_feature(cfeature.COASTLINE)
ax.add_feature(cfeature.BORDERS)

plt.show()
You can also add lakes and rivers:
ax.add_feature(cfeature.LAKES)
ax.add_feature(cfeature.RIVERS)
These layers are useful for providing geographic context to analytical datasets.
Plotting Raster Data With Cartopy
Cartopy can also be combined with NumPy and raster datasets to visualize gridded geospatial information.
A simple example using an array:
import numpy as np
import matplotlib.pyplot as plt
import cartopy.crs as ccrs

data = np.random.rand(100, 150)

fig = plt.figure(figsize=(10, 6))

ax = plt.axes(projection=ccrs.PlateCarree())

ax.imshow(
    data,
    extent=[-120, -70, 25, 50],
    transform=ccrs.PlateCarree(),
    origin="upper"
)

ax.coastlines()

plt.show()
In real GIS workflows, the raster values would typically come from datasets such as GeoTIFF, NetCDF, or cloud-based geospatial data rather than randomly generated values.
Using Cartopy With Xarray
Cartopy is especially useful with Xarray for climate, weather, oceanographic, and satellite datasets.
For example:
import xarray as xr
import matplotlib.pyplot as plt
import cartopy.crs as ccrs

data = xr.open_dataset("climate_data.nc")

fig = plt.figure(figsize=(10, 6))

ax = plt.axes(projection=ccrs.PlateCarree())

data["temperature"].plot(
    ax=ax,
    transform=ccrs.PlateCarree()
)

ax.coastlines()

plt.show()
Xarray manages multidimensional scientific datasets, while Cartopy handles geographic visualization and coordinate transformations.
Common Errors When Using Cartopy
Incorrect CRS
A common problem occurs when the data CRS is not correctly specified.
For example:
ax.scatter(
    longitude,
    latitude,
    transform=ccrs.PlateCarree()
)
If the input data is actually in another CRS, the resulting locations may be incorrect.
Missing Cartopy Installation
If Python cannot find Cartopy, install it with:
pip install cartopyFor some environments, especially scientific Python distributions, installing Cartopy through Conda may be easier.
Incorrect Map Extent
An inappropriate extent can make geographic features appear missing. Check the longitude and latitude ranges of your dataset before setting the map extent.
Cartopy is a very useful library to generate maps using Python, especially when geographic projections and coordinate transformation are needed. The use of Cartopy together with Matplotlib allows for the generation of maps ranging from basic coastlines to very complex maps containing raster, climate, satellite, or environmental data.
In more complex scenarios, Cartopy can also work in conjunction with GeoPandas, Xarray, Rasterio, NumPy, Shapely, among others. It is key to know projections and the input coordinate reference system using the transform argument in order to produce accurate maps.
With geospatial datasets being generated constantly, tools like Cartopy allow flexibility in generating geographic maps using Python.
For more information or any questions regarding mapping and spatial data visualization, please don't hesitate to contact us at
Email: info@geowgs84.com
USA (HQ): (720) 702–4849


Comments