
Best online tools for mapping and spatial data visualization
Online mapping and visualization of spatial data is now an important part of Geographic Information Systems (GIS), remote sensing, urban planning, environmental observation, and geospatial analytics. Modern tools help turn geospatial data into maps, conduct spatial analysis, reveal geospatial patterns, and present location-based information via web-based interfaces.
As more and more spatial data, including satellite images, drone observations, LiDAR point clouds, and cloud-based geospatial data, becomes available, more and more organizations use web-based mapping tools to process, visualize, and distribute geospatial information.
Modern tools can support tasks ranging from raster analysis and vector data visualization to 3D mapping and other Internet-based geospatial applications. This article covers some of the best online tools for web-based mapping and spatial data visualization, including their technical capabilities, supported data types, and practical uses.
This article considers several of the best online tools for web-based mapping and spatial data visualization, their technical capabilities, supported data types, and practical usage in geospatial tasks.
What Is Spatial Data Visualization?
Spatial data visualization refers to the representation of geographical data using various maps, charts, dashboards, and other visualizations. It assists the user in understanding the geographical distribution of data, finding spatial patterns, and analyzing correlations among different datasets.
The main datasets used in spatial visualization are:
Vector data: Contains geometric data about points, lines, and polygons on a map. Examples include GeoJSON, Shapefile, GeoPackage, and GeoParquet.
Raster data: Consists of georeferenced images or grid-like datasets that have information about continuous surfaces or gridded data. Examples include GeoTIFF, Cloud Optimized GeoTIFF (COG), and NetCDF.
Modern mapping software can work with multidimensional datasets, three-dimensional terrains, point clouds, and geospatial temporal data.
Best Online Tools for Mapping and Spatial Data Visualization
ArcGIS Online
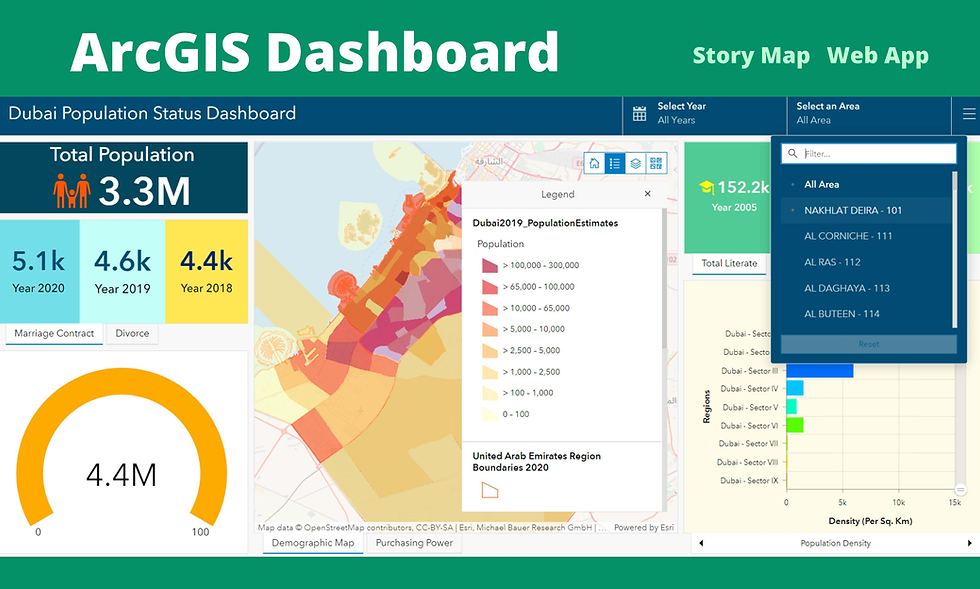
ArcGIS Online is a GIS technology based on a cloud platform provided by Esri and is used to create, manage, analyze, and share interactive maps.
Professional GIS operations are possible with the help of web maps, hosted feature layers, dashboards, and analysis of spatial data.
Technical capabilities include the following:
Interactive creation of 2D web maps and 3D scenes.
Visualization of point, line, polygon, and raster datasets.
Creating thematic maps with graduated color and proportion symbols.
Creation of interactive dashboards including charts, filters, and geographic indicators.
Sharing maps and GIS apps using access controls.
Integration of spatial data into other Esri apps.
Examples of use: urban planning, infrastructure management, environmental monitoring, asset tracking, and public information dashboards.
Official website: ArcGIS Online
GeoWGS84.ai

GeoWGS84.ai is a cloud geospatial artificial intelligence and imagery hosting platform developed by GeoWGS84 Corp. The product provides users with capabilities for geospatial data management, online visualization, geospatial AI-assisted analysis, and remote sensing.
It allows geospatial professionals to process satellite, aerial, and drone imagery, while also integrating artificial intelligence into spatial analysis.
Core capabilities:
Cloud imagery hosting: Store and manage geospatial imagery using cloud infrastructure.
Visualization: Visualize geospatial datasets on the web.
GeoAI workflow: Implement geospatial AI and machine learning tasks.
Image annotation: Create annotated geospatial datasets for computer vision and deep learning workflows.
Object detection and segmentation: Perform object detection and object segmentation to automate geographic feature identification.
Raster analysis: Perform tasks related to imagery for classification and spatial analysis purposes.
Model workflows: Implement geospatial model development and deployment processes.
In addition, GeoWGS84.ai allows geospatial AI use for building footprint extraction, vegetation analysis, wildfire delineation, and infrastructure monitoring.
Applications: Satellite imagery analysis, land cover classification, agriculture monitoring, urban planning, disaster assessment, and geospatial machine learning.
Explore the platform: GeoWGS84.ai.
Kepler.gl

Kepler.gl is an open-source, web-based geospatial visualization tool that allows users to explore large datasets of location data. It leverages WebGL rendering for interactive visualization and spatial analysis.
Technical Features:
Ability to import geographic datasets using drag-and-drop functionality.
Creation of heatmaps, point maps, arc maps, and hexagonal clusters.
Implementation of interactive filtering and playback.
Visualization of trajectories and origin/destination patterns.
Geographic distribution analysis using spatial clustering.
Integration of custom visualizations within React applications.
Applications: Transportation analytics, mobility analysis, logistics optimization, urban movement analysis, and location intelligence.
Official website: Kepler.gl
Mapbox

Mapbox is a mapping service that offers mapping technologies to create customizable web and mobile mapping solutions.
The company’s development tools provide dynamic map rendering, location-driven interfaces, and cartographic visualization.
Major technical capabilities include:
Map interactive vector and raster maps.
Customize maps in terms of styles, symbols, labels, and visual layers.
Integrate geographic information into web applications.
Create location-driven interfaces and mapping dashboards.
Perform geospatial visualization via JavaScript APIs.
Offer an interactive map experience for various platforms.
Applications: Navigation software, delivery logistics systems, location-based solutions, real estate mapping, and GIS solutions.
Official website: Mapbox
Google Earth Engine

Google Earth Engine is an online geospatial analysis software that allows users to analyze massive amounts of satellite imagery and environmental data.
This tool is a combination of a multi-petabyte catalog of geospatial data and computational tools for remote sensing and scientific analysis.
Technical features:
Analysis of satellite imagery from satellites like Landsat and Sentinel.
Raster calculations and calculation of various spectral indices.
Image classification and change detection.
Creating animated maps with time series showing changes in the environment.
Creation of interactive maps with JavaScript and Python API.
Analysis of large geographic areas through cloud computing.
Areas of application: Monitoring of deforestation, vegetation, agriculture, land cover classification, and climatology studies.
Official website: Google Earth Engine
Online mapping and visualization of spatial data are essential components of GIS, remote sensing, and geoanalytics today. Whether these technologies are cloud-based platforms, web-based GIS services, interactive JavaScript libraries, visualization solutions, or GeoAI systems, they enable users to turn geographic data into spatial insights.
The platform you choose depends on the complexity of the project, data types, rendering, analysis, and integration.
If organizations work with satellite imagery, aerial data, drone data, and AI-driven geoanalysis, GeoWGS84.ai provides an online solution that includes imagery hosting, visualization, and GeoAI components.
With such a combination of efficient data management, interactive mapping, and spatial analytics, organizations can build their geospatial processes in various industries, including environmental monitoring, infrastructure development, agriculture, and location intelligence.
For more information or any questions regarding mapping and spatial data visualization, please don't hesitate to contact us at
Email: info@geowgs84.com
USA (HQ): (720) 702–4849


Comments