
What is SAVI? A Complete Guide to Soil Adjusted Vegetation Index
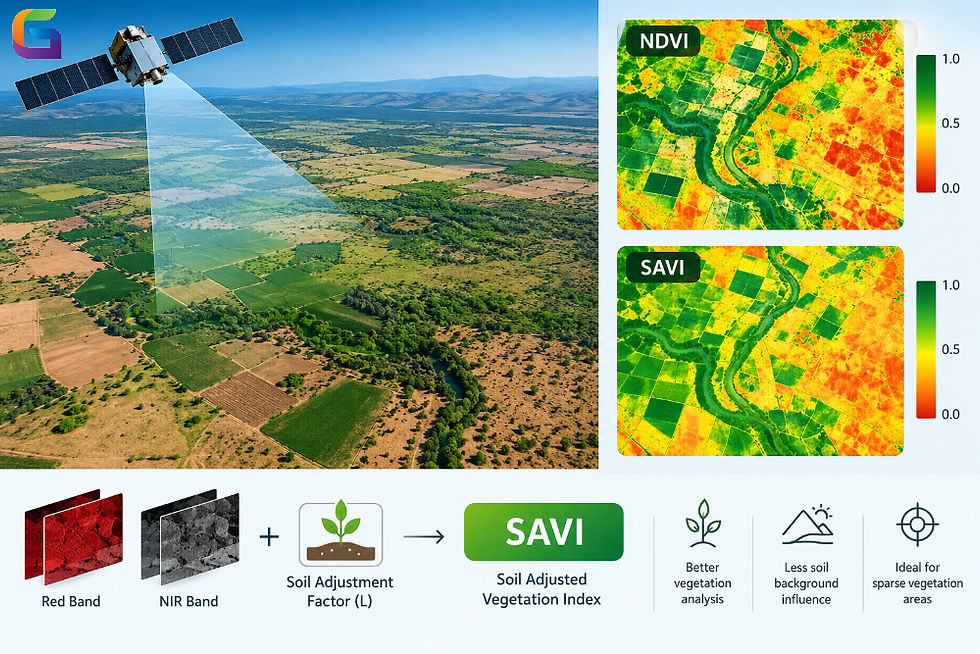
The Soil Adjusted Vegetation Index (SAVI) is a satellite-based vegetation index developed specifically for measuring vegetation density and minimizing the effect of soil background on spectral reflectance. It has been proven to be especially effective in locations where there are low vegetation densities, since other vegetation indices like NDVI can be highly affected by soil background in such regions.
The SAVI utilizes near-infrared (NIR) and red bands, together with a soil correction term.
What Is SAVI?
SAVI is an index for vegetation that was designed to reduce soil brightness influence on vegetation measures. In regions with high vegetation density, the impact of the soil background is not significant on vegetation indices. In arid, semi-arid, agricultural, and recently disturbed regions, vegetation can cover only a small part of the soil surface.
SAVI can be used in vegetation measurement where soil is seen between vegetation because of the inclusion of a soil adjustment parameter.
Values for SAVI are typically within the range of -1 to +1, although this range can differ based on surface conditions and data from the sensor. Positive values usually show high vegetation cover, while low or negative values denote bare soil, water bodies, or no vegetation.
SAVI Formula
The general formula for SAVI is as follows:
SAVI = ((NIR – Red)/(NIR + Red + L)) * (1 + L)
Where:
NIR = Near-infrared reflectance
Red = Red-band reflectance
L = Correction for soil brightness
The L term has been introduced in order to account for the effects of soil brightness. One of the popular values of L is 0.5, indicating a medium correction for soil brightness. This may not be ideal for all conditions, depending on the vegetation cover.
For example:
SAVI = ((NIR – Red)/(NIR + Red + 0.5)) * 1.5
How Does SAVI Work?
Healthy vegetation reflects less red light because of the presence of chlorophyll, but on the other hand, healthy vegetation reflects a high amount of near-infrared radiation due to its physical composition. SAVI works on this concept to measure the presence of vegetation.
A soil correction factor is used to minimize variability because of the different soil background. It plays an essential role, especially in cases of less vegetation where the images captured by the sensor consist of both vegetation and soil.
The general workflow is:
Obtain satellite or aerial imagery that is multispectral.
Choose red and NIR bands.
Process the imagery into surface reflectance values.
Calculate SAVI using the equation.
Create a SAVI raster.
Identify the spatial distribution of vegetative cover and health.
Why is Soil Adjustment Factor Necessary?
Soil background has an effect on vegetation index computation. Even though two places may have equal vegetation density, the response in terms of reflectance is not always the same because of different soil brightness.
The L factor corrects for this problem of soil background. It can be varied depending on vegetation:
L = 1: Usually applicable for very low vegetation coverage.
L = 0.5: General value used.
L = 0: Same as NDVI.
Hence, SAVI becomes particularly useful for regions with incomplete vegetation coverage over the soil background.
SAVI vs. NDVI
SAVI and NDVI both make use of red and near-infrared reflectance for characterizing vegetation. The only difference is that the SAVI index makes use of another adjustment term for soil.
Feature | SAVI | NDVI |
Red band | Yes | Yes |
NIR band | Yes | Yes |
Soil adjustment | Yes | No |
Sparse vegetation | Highly useful | Can be soil-sensitive |
Dense vegetation | Useful | Highly useful |
Formula complexity | Higher | Lower |
The use of NDVI is recommended for general vegetation detection, although SAVI might be more appropriate when soil affects the spectral characteristics.
SAVI Data Sources
SAVI can be derived from multispectral images having the red and near-infrared (NIR) spectral bands. Common sources are satellites and aerial surveys.
These include:
Landsat satellite imagery
Sentinel-2 multispectral imagery
High-resolution satellite imagery from commercial companies
Multispectral imagery acquired by drones
It is important to note that the exact bands to use when computing SAVI will differ depending on the imaging sensor being used. Therefore, one should be familiar with the band specifications of the imaging sensor before computing SAVI.
How to Calculate SAVI in GIS
SAVI can be computed using the raster processing capability provided by GIS software. In general, this involves loading surface reflectance imagery, choosing the correct red and NIR bands, and computing the SAVI index using the raster calculator.
For example, one might compute the SAVI index as follows:
((NIR - Red) / (NIR + Red + 0.5)) * 1.5
Then, classify the raster using an appropriate vegetation index classification scheme.
Advantages of SAVI
There are many advantages of SAVI, including the following:
Reduces the effect of soils in the background.
Suitable in the presence of sparse vegetation cover.
Relies on red and NIR bands, which are easily accessible.
Can be determined from different multispectral data sets.
Is useful in vegetation mapping and monitoring.
Is useful in agriculture and drylands.
Can be combined with other GIS and remote sensing data sets.
Disadvantages of SAVI
Despite its usefulness, SAVI cannot be used in all cases of monitoring of vegetation. One of the disadvantages of SAVI is that the value of the parameter L used in it can affect the results obtained, and SAVI relies on the quality of the data.
The other disadvantages include the following:
Proper red and NIR reflectance values should be used.
It may be affected by atmospheric and radiometric errors if the image is not corrected.
One value of L may not work uniformly under different vegetation conditions.
There is little additional advantage it can give over NDVI in the case of dense vegetation.
SAVI in Remote Sensing and GIS
One can apply the SAVI technique for analysis of vegetation in cases when exposed soils may have an impact on traditional vegetation indices. Thanks to the soil brightness factor, it becomes possible to estimate the amount of vegetation in a landscape with exposed soil.
In addition, for GIS and remote sensing procedures, it would be useful to use SAVI along with such tools as NDVI, NDWI, EVI, land cover data, digital elevation models, soil data, and time series.
The Soil Adjusted Vegetation Index (SAVI) is a vegetation index in remote sensing designed to provide improved vegetation analysis when the soil has a significant effect on the measurement results. The use of the red band, the near-infrared band, and the soil brightness factor allows obtaining valuable results when analyzing sparse vegetation, agricultural lands, arid regions, and semi-arid regions.
Even though the NDVI is among the most common vegetation indices used today, SAVI can become more effective when it is necessary to minimize the impact of the soil background. Comparing different vegetation indices, including SAVI and NDVI, one can choose the most effective one for a specific analysis.
For more information or any questions regarding SAVI, please don't hesitate to contact us at
Email: info@geowgs84.com
USA (HQ): (720) 702–4849
(A GeoWGS84 Corp Company)


Comments